GIDNetwork > JSP Power Debugger
Register
« Beginning Python Tutorial (Part 12)  

JSP Power Debugger

by: Paramesh - Jul 19, 2008

With Power Debugger, you can save hours of debugging in development and deployment.

Here are the some salient features:

  1. Search items in Session, Request and Context.

  2. toString() replacement – Using Java Reflection to dynamically display all the values in a VO.

  3. Navigate through the items easily thro links.

  4. Support for Collections, Dyna Action Forms and Arrays.

  5. Support for EL like expressions. Seamlessly navigate the entire hierarchy of items.

  6. Improved Usability and UI.


All you have to do is to put this Debug.jsp in the Web Content folder of your application and start using it.
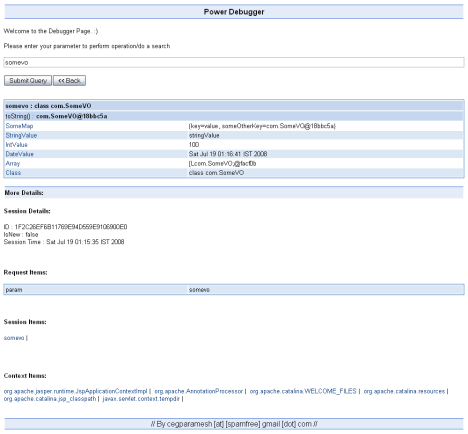
The main use will be in QA environments, where we you can’t debug as like Eclipse. Some Screenshots are attached. Have a look at it..

Feel free to contact me for feedback, improvements and bug fixes.

Guide:

  • To search for an item in the session or context, type in the Search bar, or click a value from the list displayed.

  • Click on the links displayed if you want to traverse the tree.

  • You can search from collections, Struts Action Form or a VO(value object) by using the "." operator.

  • For arrays and collections, you can use the array operator:"[]"

The code is licensed under GNU General Public License v3.

Download the File here. Put it inside the Web Content folder, and hit the URL of this JSP.

For example, if you are using Tomcat, you must hit the URL: http://localhost:8080/ApplicationName/Debug.jsp

Here is a screenshot:

More screenshots here:
Power Debugger toString()
Power Debugger Array

Would you like to comment? This story has been viewed 49,272 times.
« Beginning Python Tutorial (Part 12)  

__top__

Copyright © GIDNetwork™ 2001 - 2024

Another website by J de Silva

Page generated in : 0.00754 sec.